
Trendlines
Bullish Figures for Gold!
It has been a while since we have focused on the price charts, but this would be a good time. On Tuesday, the Nasdaq tumbled 2.6 percent for its lowest close since October, while the Dow dropped 540 points on the day.
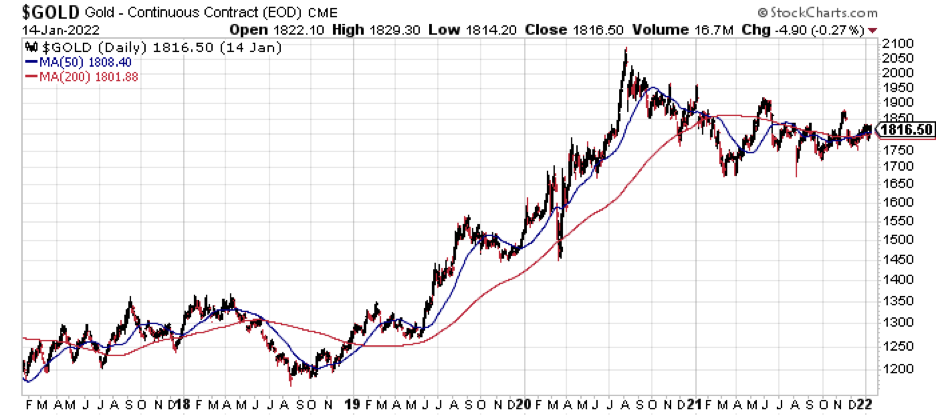
Gold has been trading mostly sideways this year, and now has held over $1,800 an ounce for more than a week.
We note as well that gold is trading above its 50- and 200-day moving averages, both of which are moving higher as well.
Because this move defies the conventional wisdom, with the prospect of the Fed raising interest rates several times this year and with the yield on the 10-year Treasury pushing higher as well (and also trading over its 50- and 200-day moving averages}, we consider this picture for gold especially bullish.
Here is a five-year chart of oil prices (West Texas Intermediate Crude).
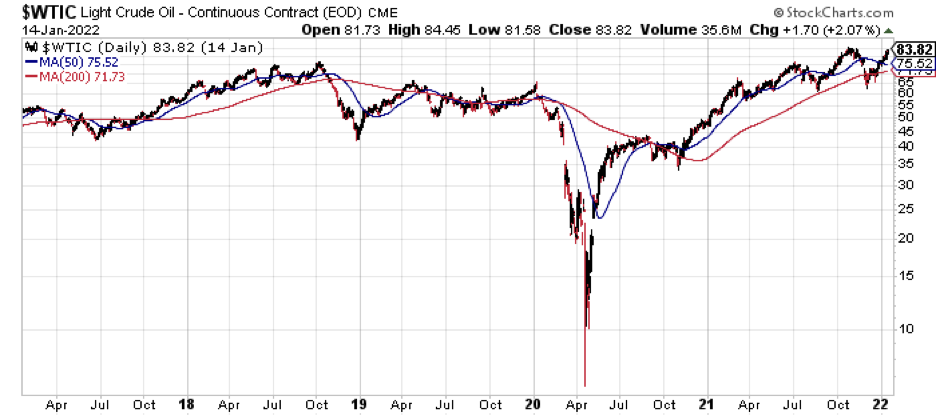
Oil has marched determinedly higher since its lockdown low nineteen months ago. It is now trading above its 50- and 200-day moving averages. That may be an indicator as well of an environment bullish for gold. It is also likely that oil prices are firming in anticipation of armed conflict. The standoff over Ukraine grows more intense with each passing week. Any such conflict, needless to say, is hyper-bullish for gold.
Finally, just a remark about our impression of conditions in America in January 2022. Store shelves are sporadically empty, retailers’ product inventories appear to be narrowing, many doctor’s offices are acutely understaffed, and emergency room waiting times appear to be growing. With inflation at seven percent and wholesale prices rising at almost ten percent annually, we think it fair to judge that the monetary system is in crisis. Thus, we must repeat the time-worn observation that when the monetary system goes, everything goes.