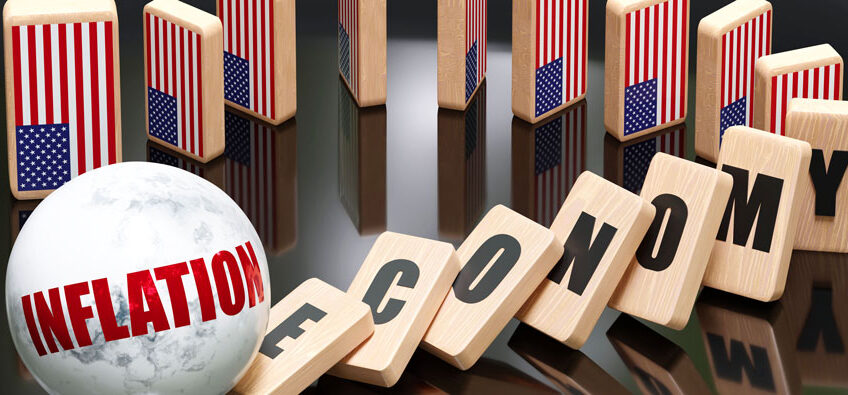
Inflation on Display
The US 12-month inflation rate as measured by the Consumer Price Index has been over 8 percent for 7 months in a row, since last March. It has been raging along over 5 percent for 14 months in a row.
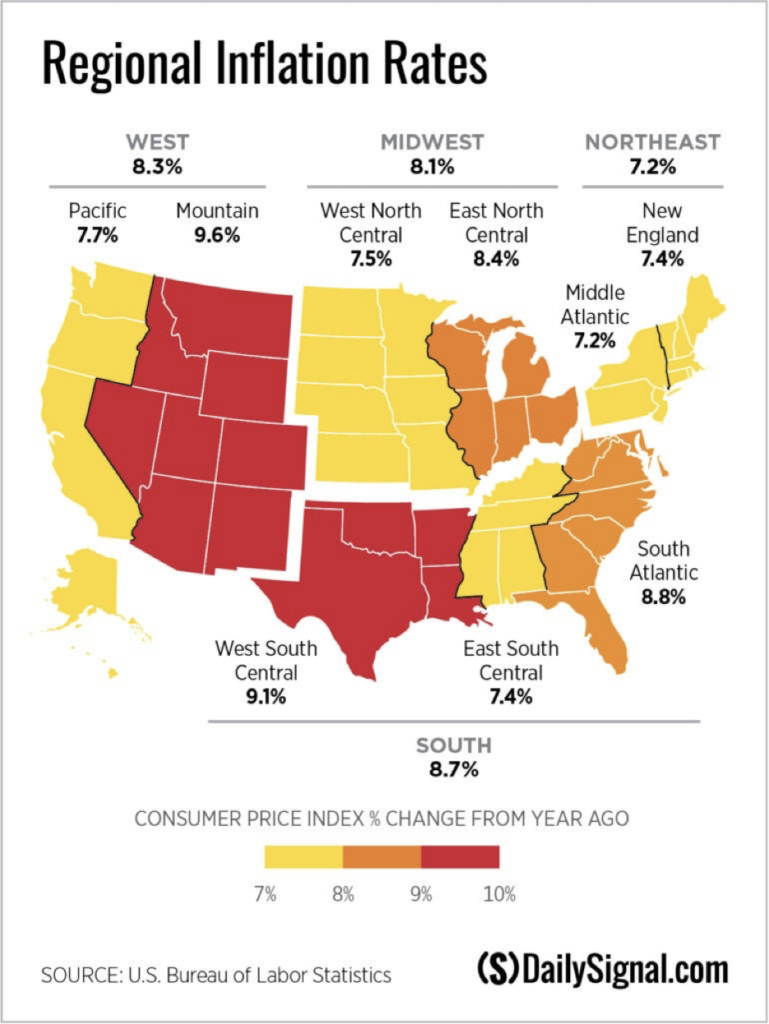
The pain is not evenly distributed across the county. As you can see in the following graphic, inflation has hit hardest in the Mountain West region and in the West South-Central region.
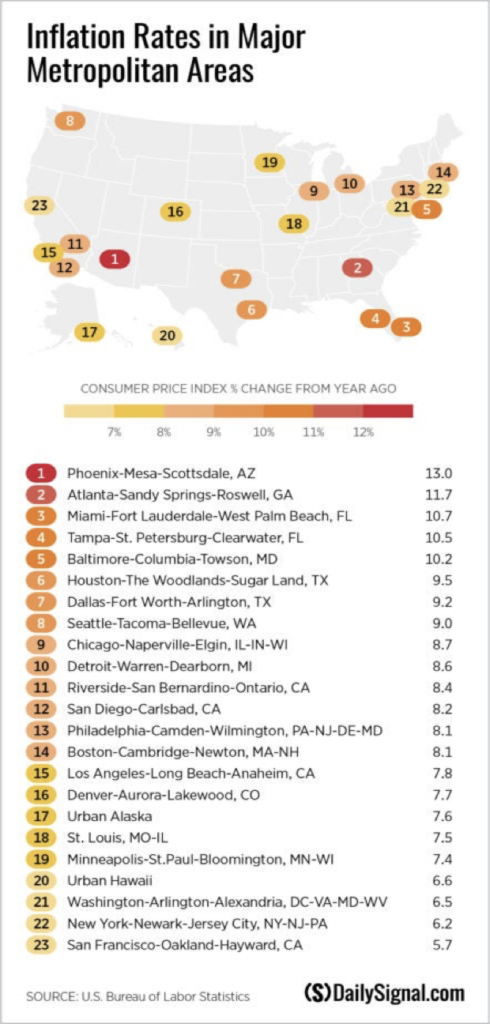
The highest inflation rate by far has been in the Phoenix Metropolitan area. Their consumer prices have risen at a 13 percent annual rate. The next closest is the Atlanta metro at 11.7 percent, followed by the Miami and Tampa regions and Baltimore, which are registering double-digit inflation rates.
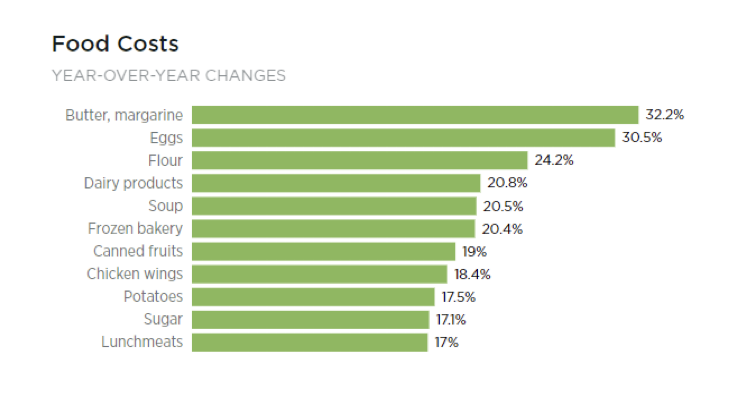
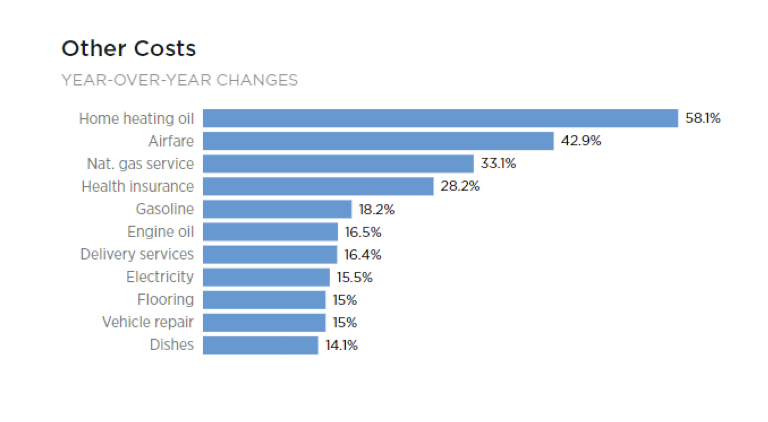
To round out the picture here is a breakdown of the increase in food and other costs over the past 12 months. You will note the home heating oil is show the greatest price increase of all the items, just in time for the high-demand winter months.
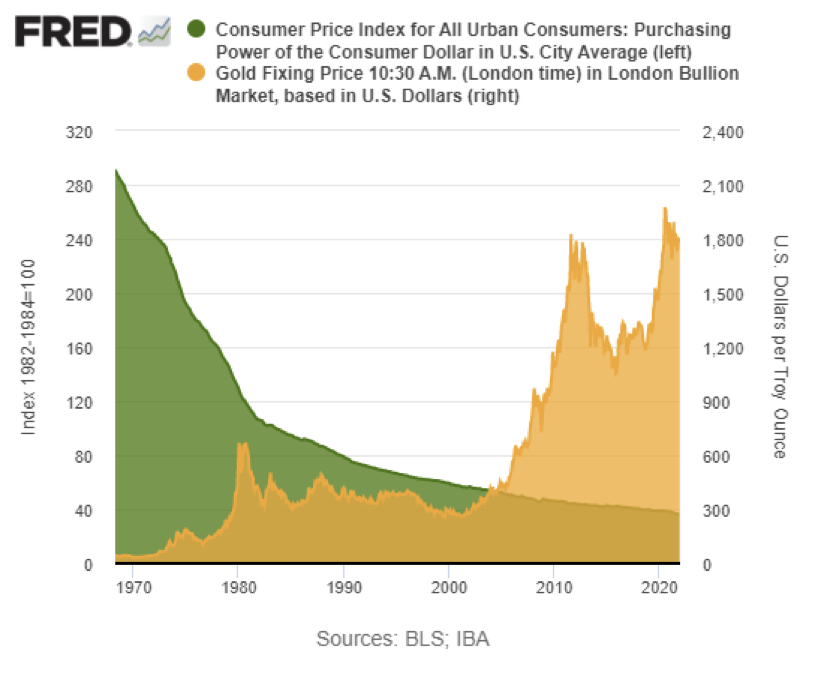
And finally, we think it is time to include one of the most revealing graphs of this era. It is a long-term trend chart showing the gold price against the declining purchasing power of the US dollar.
For more information about adding gold and silver to your wealth preservation and profit strategy, speak with a Republic Monetary Exchange specialist today.